Why Consider Colours in Analysis for Individuals with Colour Vision Deficiencies?
Analysts with colour vision deficiencies) may struggle with traditional red-green alerts, heatmaps, and data visualisations. Here’s why it matters.
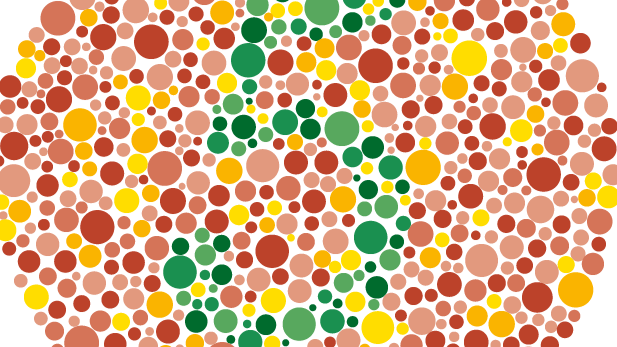
When presenting Open Source Intelligence (OSINT) findings or Cybersecurity Intelligence, colour is often used to differentiate data, highlight risks, and improve readability. However, not everyone perceives colour the same way; individuals with colour vision deficiencies (CVD), commonly known as colour blindness, may struggle with traditional colour-coded visualisations. Here's why accessibility matters:
Common Colour Weaknesses and Their Effects
- Red-Green Weakness - Trouble telling red from green, often used for alerts and statuses.
- Blue-Yellow Weakness - Challenges telling blue from yellow, which can change the meaning of some data heatmaps.
- Monochromacy - An uncommon condition where anything coloured appears as varying shades of grey.
Why It Matters in Intelligence and OSINT
🔸 Critical Warnings Can Be Missed – If threat levels, alerts, or heatmaps rely solely on red-green distinctions, users with CVD may not recognise high-risk indicators.
🔸 Data Misinterpretation – Charts and graphs may lose meaning if colour-coded groupings are indistinguishable.
🔸 Collaboration Barriers – Intelligence sharing should be universally accessible to ensure all analysts can effectively engage.
Best Practices for Inclusive Analysis
✅ Use Colour + Text or Symbols – Instead of relying on colour alone, add labels, patterns, or icons (✔️❌⚠️) for clarity.
✅ Choose CVD-Friendly Colour Palettes – Use high-contrast schemes like blue and orange instead of red and green.
✅ Test with Colour Blind Simulations—Tools like Coblis or built-in accessibility checkers in Power BI and Tableau help simulate different colour deficiencies.
✅ Allow Customization – Provide options for users to adjust themes or toggle alternative visualisation modes.
OSINT and Cybersecurity in Practice
🔹 Threat Intelligence Dashboards – Ensure high-risk alerts (e.g., breach warnings) are distinguishable without relying on red-green contrast.
🔹 Graph-Based Analysis – Use solid/dashed lines or different shapes instead of colour-based node connections.
🔹 Heatmaps and Risk Scores – Consider grayscale-friendly alternatives or adjustable contrast levels.
Conclusion: Accessible Design Improves Intelligence for Everyone
When creating OSINT reports and Cybersecurity dashboards, we always consider colour accessibility so that the intelligence can be actionable for all analysts, not just CVD analysts. Not to mention, non-OSINT consumers of the OSINT reports could also have a colour vision deficiency issue.
Have you run into colour issues when doing intelligence work? How did you accommodate? 🚀
Authored by: The Coalition of Cyber Investigators Paul Wright (United Kingdom) & Neal Ysart (Philippines) ©2025 The Coalition of Cyber Investigators. All rights reserved. The Coalition of Cyber Investigators is a collaboration between Paul Wright (United Kingdom) - Experienced Cybercrime, Intelligence (OSINT & HUMINT) and Digital Forensics Investigator; and Neal Ysart (Philippines) - Elite Investigator & Strategic Risk Advisor, Ex-Big 4 Forensic Leader. With over 80 years of combined hands-on experience, Paul and Neal remain actively engaged in their field. They established the Coalition to provide a platform to collaborate and share their expertise and analysis of topical issues in the converging domains of investigations, digital forensics and OSINT. Recognising that this convergence has created grey areas around critical topics, including the admissibility of evidence, process integrity, ethics, contextual analysis and validation, the coalition is Paul and Neal’s way of contributing to a discussion that is essential if the unresolved issues around OSINT derived evidence are to be addressed effectively.